Forecast growth or loss
You need Set the Budget or the board’s school summary. The Chairman, the proprietor and board members have one of them. Only Set the Budget saves a scenario; with the school summary you can try values without saving. Budget is switched on for your school by AnySchool; ask us if you don’t see Budget in the menu.
- Open Budget, then Forecast.
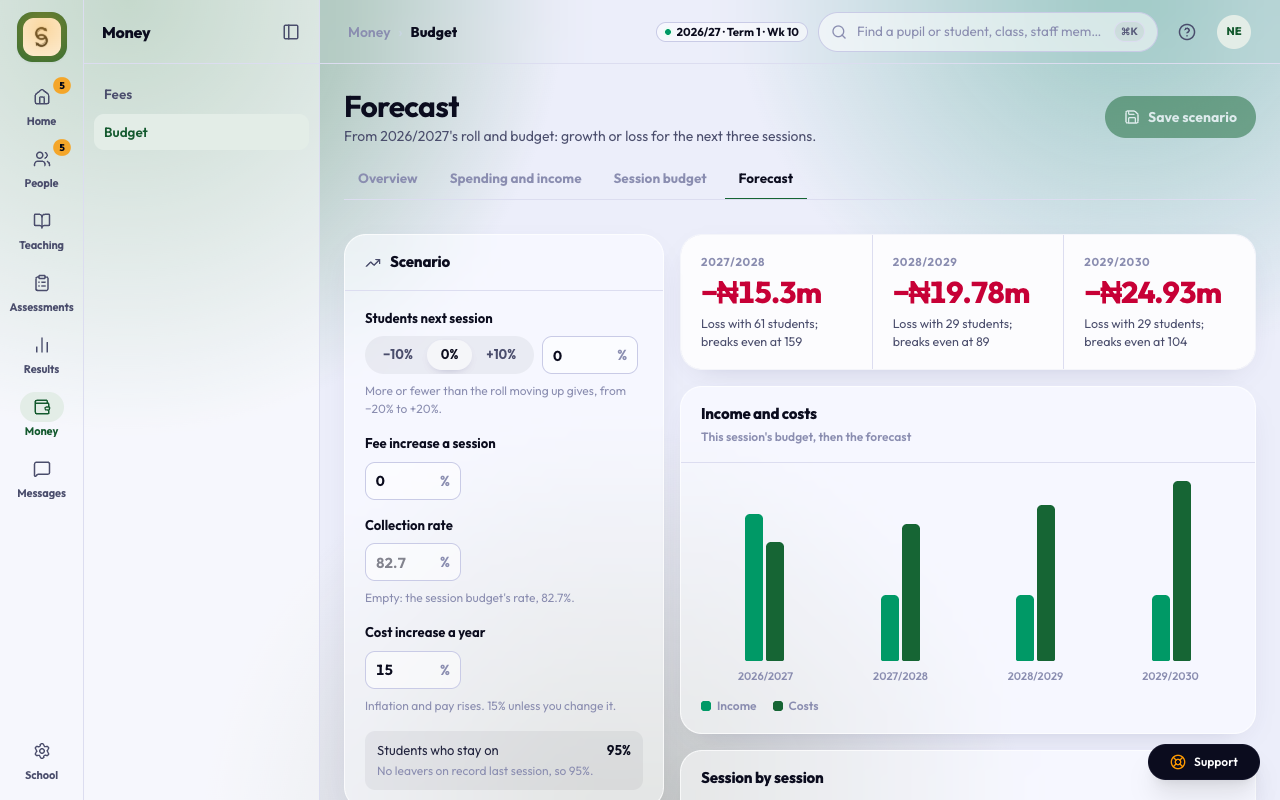
- Read the three tiles: the surplus or loss for each of the next three sessions, with the number of students and the roll at which the school breaks even.
- Under Scenario, try Students next session: pick −10%, 0% or +10%, or type anything from −20% to +20%. The tiles, chart and tables change as you type.
- Set Fee increase a session, Collection rate and Cost increase a year. Leave Collection rate empty to use the session budget’s rate.
- Select Save scenario to keep it for everyone who opens the forecast. Back to the saved scenario undoes what you’ve tried.
Where the figures come from
- Students start from this session’s roll in each class. Each class takes the class below it, less the students who leave, plus the offers and acceptances for next session in Applications. The top class leaves. If the school doesn’t run the next class up, those students are counted as leaving.
- Students who stay on is last session’s roll less its leavers. Graduates don’t count as leavers. With no leavers on record, it’s 95%.
- Fees are this session’s fees for each class, all three terms, raised by the fee increase each session. Fee income is students × fees × the collection rate.
- Costs and other income come from this session’s Session budget. Costs rise by the cost increase each year; other income stays as budgeted.
- Break-even roll is the number of students whose collected fees, with other income, cover the costs.
Staff pay is the biggest cost, and it’s typed by hand in the session budget. The forecast is only as good as that figure.
Every branch of a group
If you belong to a school group and hold the school summary, the forecast adds up every branch. Pick All branches or one branch at the top. By branch shows each branch’s surplus or loss for the next three sessions with the total for the group. A branch without Budget switched on is left out, and the page names it.
The School group page shows the same figures on each branch’s card: this term’s spending against its budget to date, and next session’s forecast. A tile at the top adds them up. Home’s Budget and forecast chart shows them too.